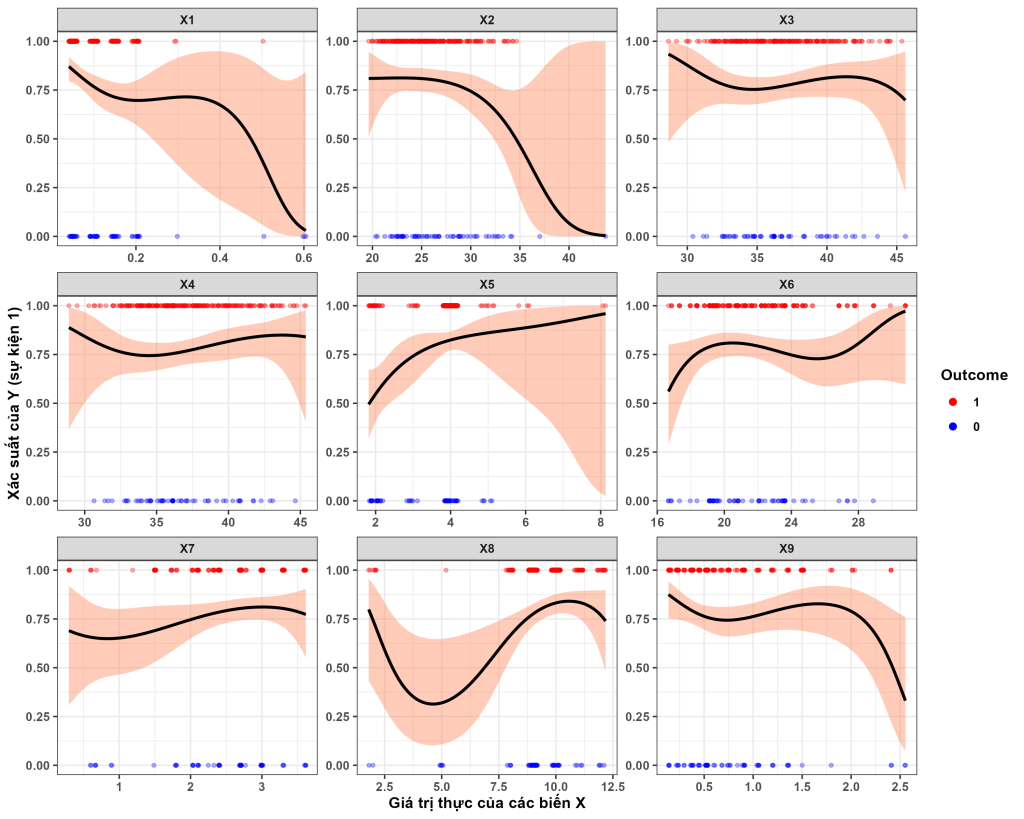
library(ggplot2)
library(tidyverse)
library(tidyr)

df <- read.csv("http://tuhocr.netlify.app/dataset/df_logistic.csv")

df$Y <- factor(df$Y,
  levels = c(0, 1)
)

df |> tidyr::gather(X1,
  X2,
  X3,
  X4,
  X5,
  X6,
  X7,
  X8,
  X9,
  key = "Feature",
  value = "Score"
) |>
  # chuyển về numeric (trừ 1 là giảm 1 nấc về 0 và 1)
  mutate(Y_num = as.numeric(Y) - 1) -> df_long


binomial_smooth <- function(...) {
  geom_smooth(
    method = "glm",
    formula = y ~ splines::bs(x, 3),
    method.args = list(family = "binomial"), ...
  )
}


ggplot(
  data = df_long,
  mapping = aes(
    x = Score,
    y = Y_num,
    color = factor(Y_num,
      levels = c(1, 0)
    )
  )
) +
  geom_point(
    alpha = 0.3,
    shape = 19,
    size = 1
  ) +
  binomial_smooth(
    color = "black",
    fill = "coral",
    alpha = 0.4
  ) +
  scale_color_manual(
    name = "Outcome",
    values = c("red", "blue")
  ) +
  facet_wrap(~Feature,
    ncol = 3,
    scales = "free"
  ) +
  xlab("Giá trị thực của các biến X") +
  ylab("Xác suất của Y (sự kiện 1)") +

  guides(color = guide_legend(override.aes = list(size = 2,
                                                  alpha = 1))) +
  theme_bw() +

  theme(axis.text = element_text(face = "bold"),
        axis.title = element_text(face = "bold"),
        strip.text = element_text(face = "bold"),
        legend.text = element_text(face = "bold"),
        legend.title = element_text(face = "bold"))

# ggsave(filename = "logistic_donbien.png",
#        height = 8,
#        width = 10,
#        unit = "in",
#        dpi = 300)